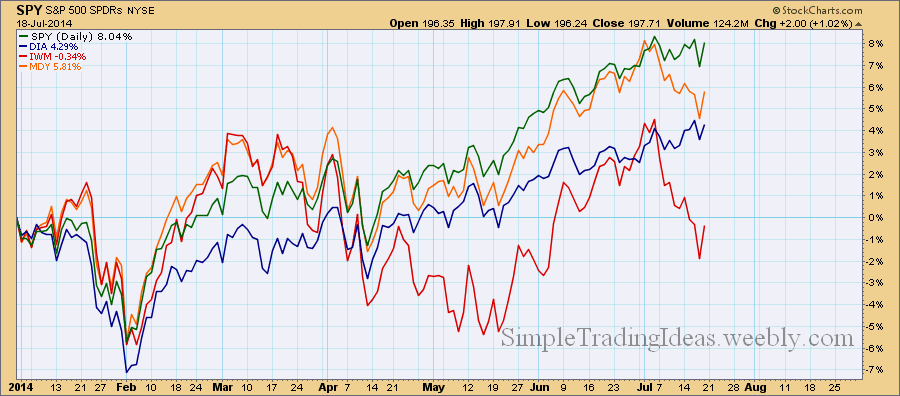
The performance chart below compares four ETFs representing the Mega-Caps, Large-Caps, Mid-Caps and Small-Caps. Large-Caps are the best and the Meg-Caps are trying to catch up. On the other hand Small-Caps are not doing so good.
| Simple Trading Ideas |
|
|
The performance chart below compares four ETFs representing the Mega-Caps, Large-Caps, Mid-Caps and Small-Caps. Large-Caps are the best and the Meg-Caps are trying to catch up. On the other hand Small-Caps are not doing so good.
0 Comments
MFI the Money Flow Index is a momentum oscillator calculated from both volume and price. The calculation is similar to the calculation of RSI the Relative Strength Index. For this reason it is also called the volume-weighted version of RSI. Theories suggest that volume leads price and also RSI momentum oscillator leads price. Including volume in the calculation can increase this lead time. The weekly charf below shows DIA the SPDR DJ Industrial Average ETF with MFI below the chart. Notice that DIA recently slightly moved lower but MFI failed to reach new lows. I consider this a bullish divergence. We will see the development of this divergence in the next couple of weeks. 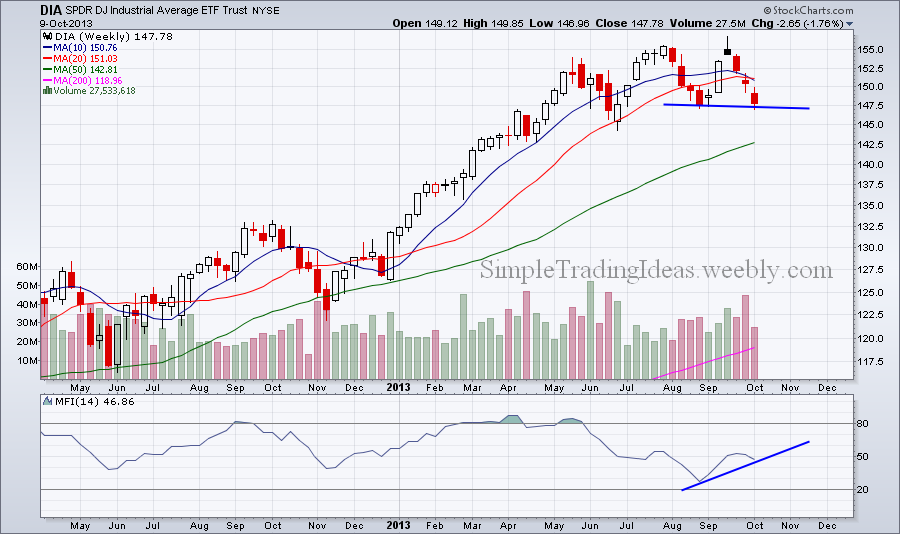
As I pointed out in the previous post small-caps are outperforming large-caps. It is also true that mega-caps are underperforming large caps. To trade the pullback you don’t want to pick a strong stock which only slightly moves lower but you want to trade a weak one. The best thing to do in this case is to pick a mega-cap stock which underperforms mega-caps, DIA. I picked Chevron, CVX for this reason. Chevron trades with S&P 500 or DIA as you can see it on the chart and underperforms it as you can see below the chart. To take advantage of the short term downtrend I entered a trade on September 23 with a bearish CVX Nov 120/125 put spread for $1.90. This spread trades for $3.05 today which is a 60% increase. The breakeven point for this trade is 125-1.90 = 123.10. CVX is currently trading at $120.83. The reason I bought a spread instead of a simple put is to better control the breakeven point, the “risk”. CVX hasn’t reached my downside target so I expect more profit from this trade before closing the position. 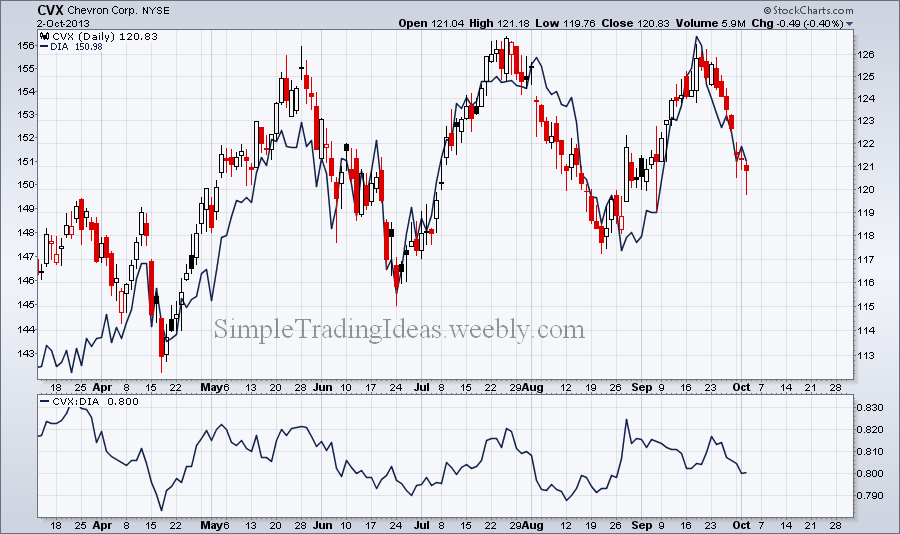
The chart below compares the performance of small-caps (IWM), mid-caps (MDY), large-caps (SPY) and mega-caps (DIA) during the past three months. Small and mid-caps has been doing much better. 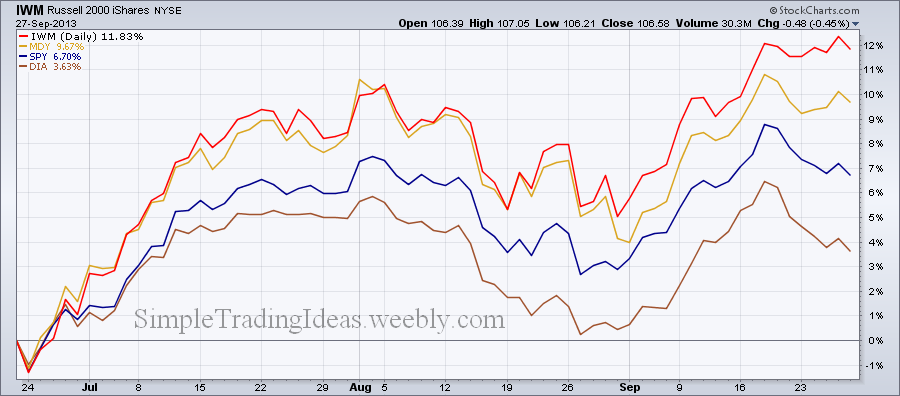
DIA, the Dow Jones Industrial Average ETF represents large caps. DIA reached higher highs but On Balance Volume, OBV has been moving lower. This is a bearish divergence and could be an alert for price or trend reversal. 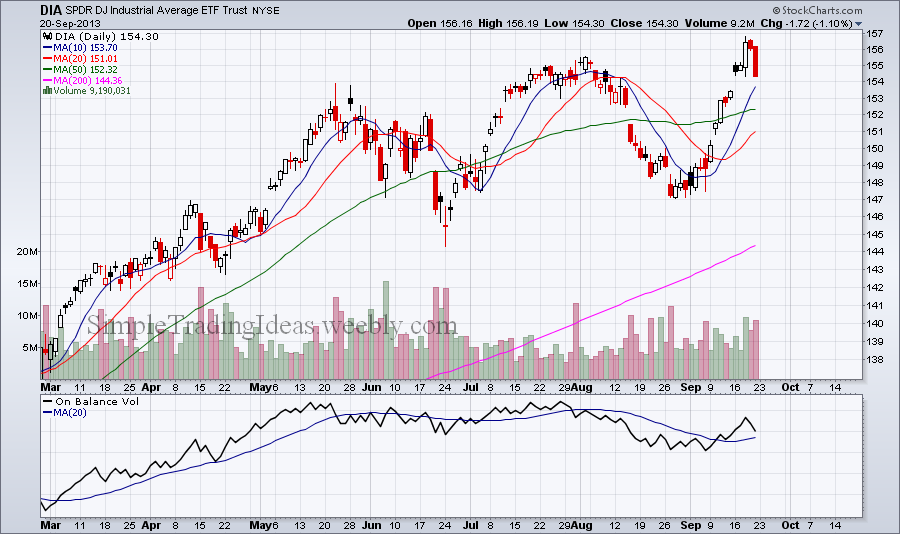 Below you can see the daily candlestick charts for DAI, SPY, IWM and QQQ. Click on Play or the Arrows to see the other charts. The chart below compares the Dow Jones Industrial Average (DIA) the S&P 500 (SPY) the Mid Caps (MDY) and the Small Caps (IWM). As you can see not all the segments of the market advanced during that time. Even the Large Caps didn't change much during the past 13 trading days. 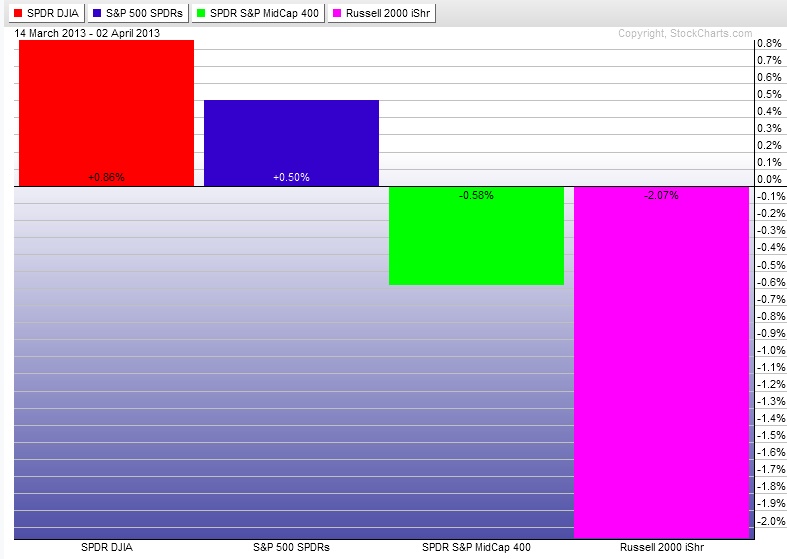
As the Market moved higher today I decided to compare the Large Caps (DIA) the S&P 500 (SPY) and the Small Caps (IWM). Normally I like it when the Small Caps are doing good and leading the Market. First let's look at the chart for SPY. Today's candle opened up with a gap moved up and back down creating a larger upper shadow. This candle looks like a shooting star which is bearish. Also notice that the 10-day SMA crossed below the 20-day SMA and the price moved pretty far from the 10-day SMA which is sort of turning down. 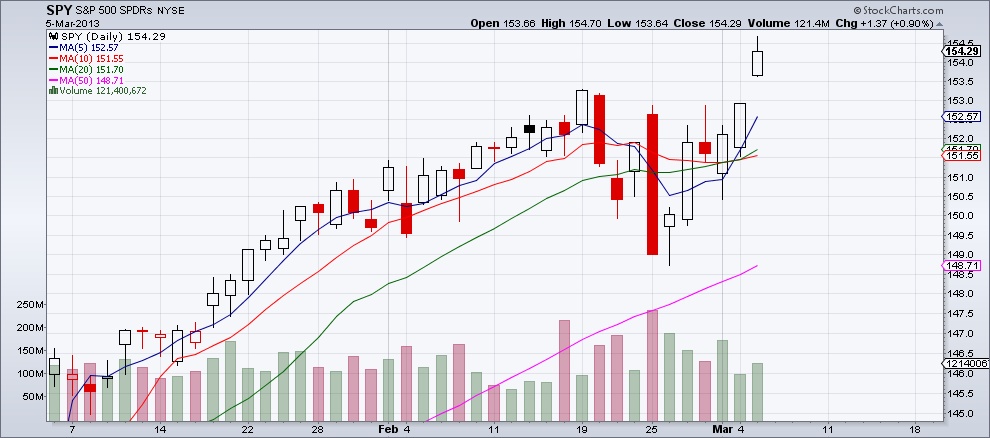
The chart for the Small Caps (IWM) shows more weakness. The 10-day SMA is definitely turning down. 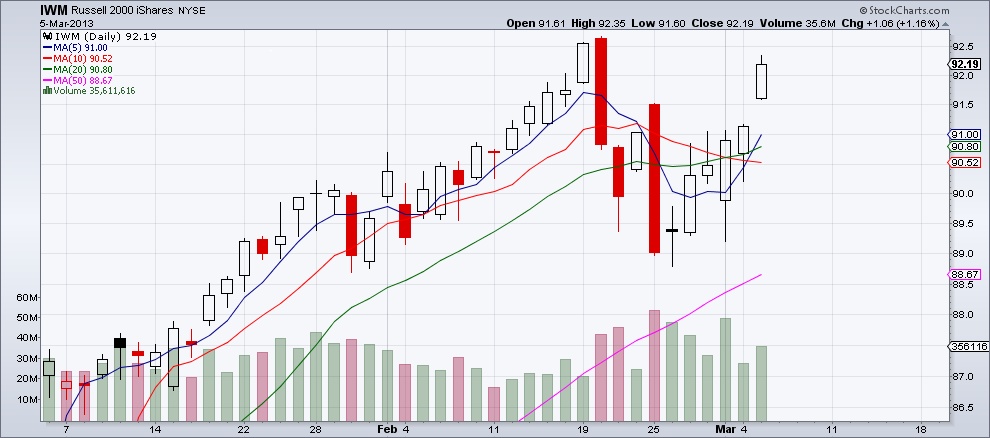
There is no question about it, out of the three the Large Caps are the best 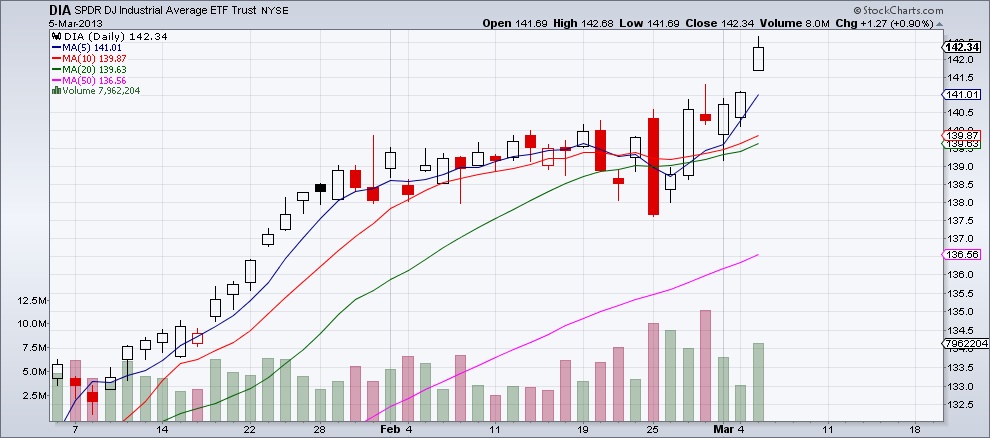
|
Loading
Search Site
Links
Archives
September 2014
Categories
All

|
 RSS Feed
